Each month our clients receive an analytics dashboard with key metrics about your website. There may be some terms or metrics that you aren’t familiar with, so we’ve provided an overview of each data point here so you can better understand your analytics report.
Jump to Content
- Report Date
- Traffic
- Engagement
- How is traffic trending this month?
- What devices are visitors using?
- Where are visitors located?
- How are visitors finding the site?
- Which visitors are most engaged?
- What websites refer the most traffic?
- What are the most frequently visited pages?
- What search queries get the most clicks to the site?
- What search queries get the most impressions?
Report Date
In the upper right corner of the dashboard, you’ll find the dates for the report. By default, the report shows you the analytics for the last full month. If you click on it, a dropdown calendar will appear where you can adjust the reporting period start date and end date. This is useful to see trends over a longer period of time like last quarter or last year.

Traffic
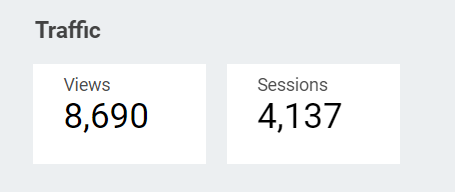
Views
“Views” refers to the total number of times a web page on your site has been visited. (This metric replaces “page views” in previous versions of Google Analtyics.) Each time a page is loaded or reloaded, it counts as one view. Because there are many reasons every single view may not get tracked (like visitors that have blocking software installed), this isn’t guaranteed to be an exact number. But your total Views can help you understand traffic trends on your site.
Sessions
A “session” is a period of time that a user is actively engaged with your website. It starts when a user enters your website and ends when they leave or after a period of inactivity, typically after 30 minutes of no interaction. During a session, a user can view multiple pages on your site. Sessions provide general insights into user engagement and behavior on your website, such as how long they spend on your site and how many pages they visit.
Engagement
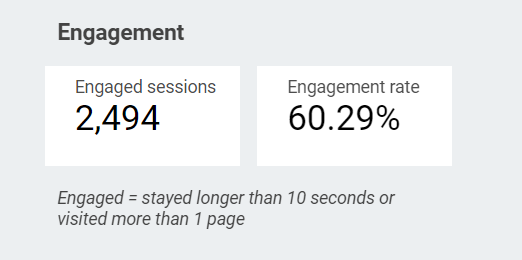
Engaged Sessions
An “engaged session” is a session in which a user completed at least one of the following:
- Visited at least 2 pages.
- Stayed on your site for at least 10 seconds.
- Interacted with your site by taking an action like clicking on a link, watching a video, or filling out a form.
Engaged sessions is a good indicator of a positive user experience on your site.
Engagement Rate
Your “engagement rate” tells you what percentage of all sessions are considered “engaged sessions.” A higher engagement rate indicates that users are more actively engaging with your website content, which can be a positive sign of user experience and satisfaction.
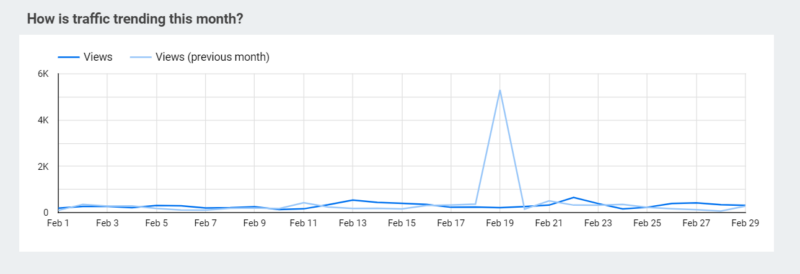
How is traffic trending this month?
This chart gives you a visual breakdown of how many views your site is receiving each day, compared to the same day the previous month. If you hover your mouse over the dates, you’ll be able to see specific data for each day. If you see a large spike or any other anomalies, it’s good to make note of what content was posted or if anything has changed that could have contributed to the variability.
What devices are visitors using?
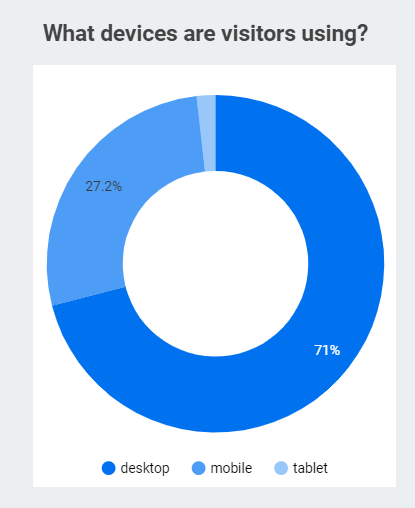
This donut chart shows you a breakdown of what type of devices visitors are using to access your site, including a desktop, mobile phone, tablet or smart TV.
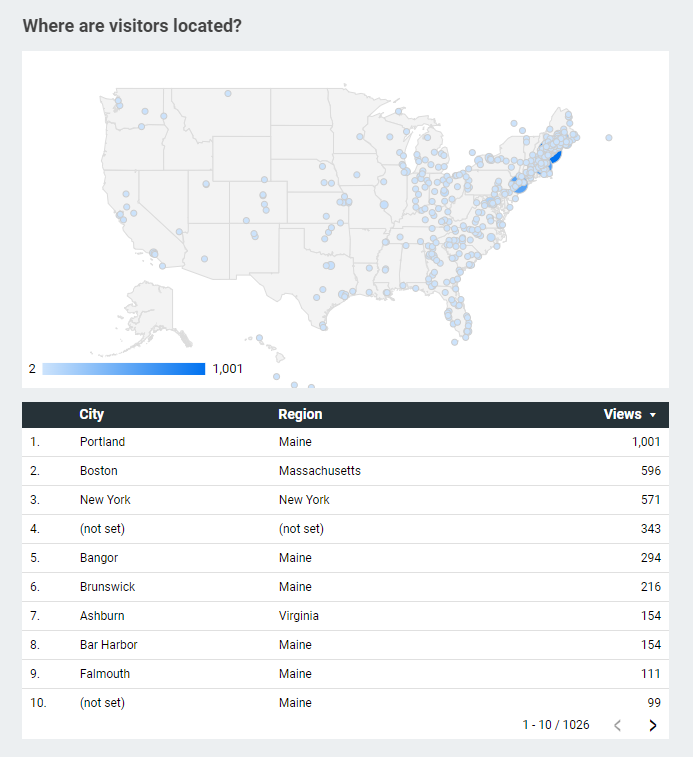
Where are visitors located?
This map and list below the map indicate where your visitors are located when they access your site.
How are visitors finding the site?
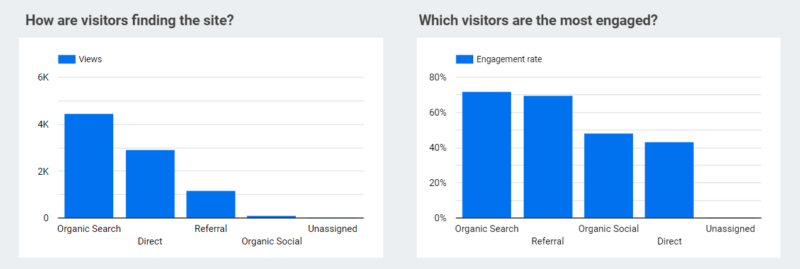
The next chart shows you how visitors made their way to your site.
- “Organic Search” means that the visitors used a search engine like Google, and then clicked on a link to your site from the search results.
- “Direct” means that the user directly typed in your URL in their browser to find you. It can also be a catch-all, meaning that it isn’t clear how they arrived there because the data is not available or campaign tracking wasn’t set up properly. For instance, traffic from an email campaign might end up being classified as Direct.
- “Referral” means that the visitor came from another website.
- “Organic Social” means the visitor came from a post on social media, not including paid social ads.
- “Paid Social” means the visitor came from a paid ad on social media.
Which visitors are most engaged?
This chart shows the engagement rate for each type of traffic described above. This can help you determine where your best and lowest quality traffic is coming from, so that you can increase your focus on your top campaigns or make improvements on others.
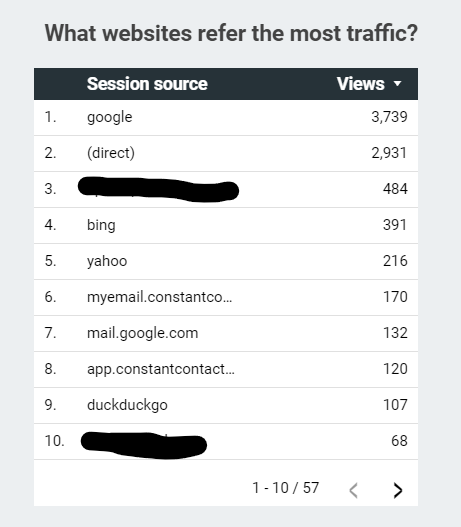
What websites refer the most traffic?
Here you can see which other websites are sending the most traffic to your website. Look for opportunities to get referrals from similar websites. Are there opportunities to increase the traffic coming from these sources?
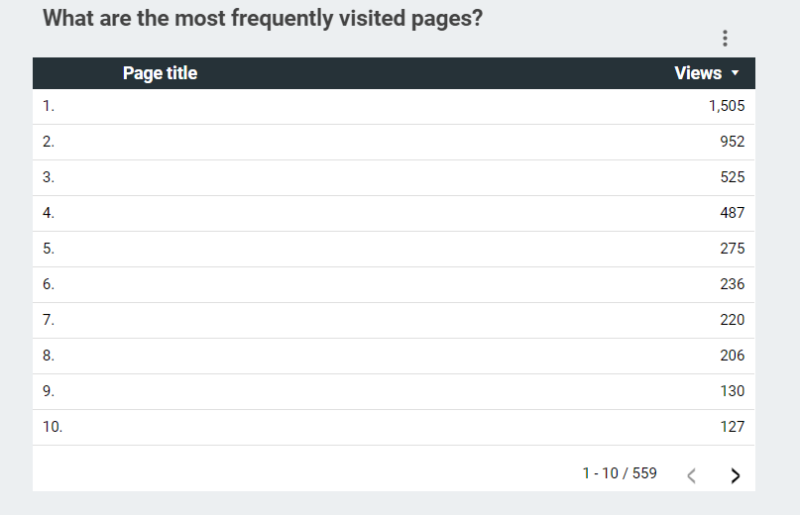
What are the most frequently visited pages?
On this list you’ll see your pages that get the most views. This gives you a good idea of the content that is the most engaging to visitors. You can also reverse the sorting to see your pages the aren’t getting many views. These might be in need of a refresh, or they could be deleted.
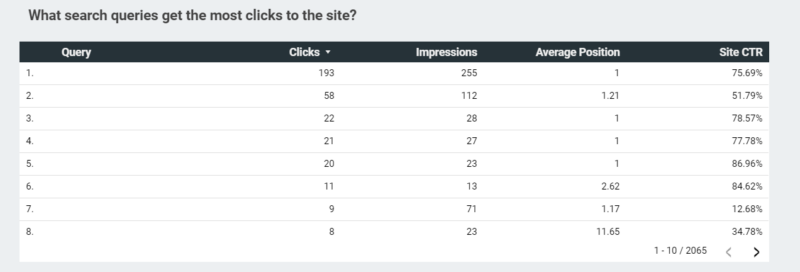
What search queries get the most clicks to the site?
This table shows you info about the Google searches that are leading to clicks to your website. This table can help you spot opportunities to improve your top content so that you get even more clicks and improve your raking position.
- Query – What users typed into a search engine that led that to finding your site.
- Clicks – How many people clicked to your site from that query.
- Impressions – The number of people who saw a link to your site when they searched a particular query.
- Average Position – The average rank of your site in search results for that query. The higher the rank, the closer it is to the top of the results. Numbers 1-10 indicate a page 1 position.
- Site CTR – The percentage of people who saw the link to your site and clicked it for that query. CTR stands for click through rate and is calculated as (clicks / impressions) * 100.
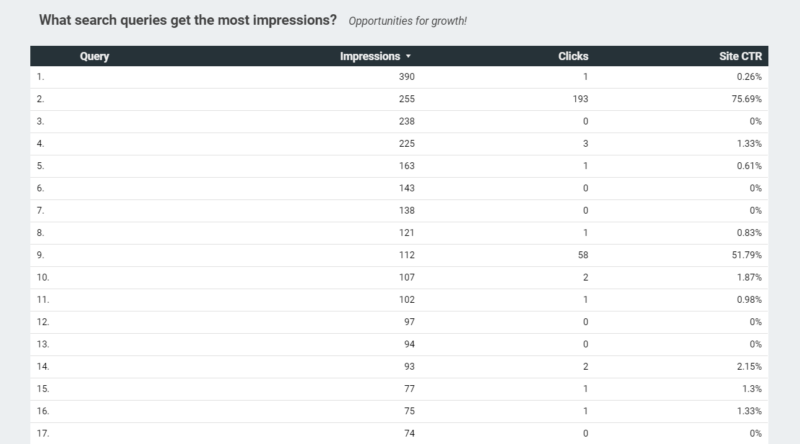
What search queries get the most impressions?
This table is using the same data as described above, but it sorted based on the queries with the highest number of impressions. That means the queries you see at the top are opportunities for growth. Your site is showing up in these searches, but is probably not currently getting that many clicks as a result. Use this info to identify queries you could optimize your site content for.
Let us know if you have questions or need help!
We know website terminology can be confusing! Please reach out if you have any questions about your analytics report, or if you’d like to discuss more advanced tracking options.
